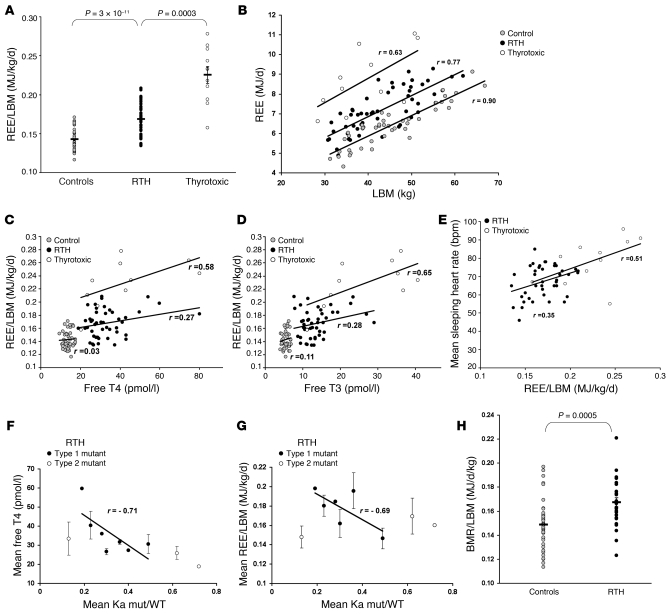
Figure 1. Energy expenditure in patients with RTH.
(A) REE expressed per unit LBM in control (gray circles, n = 45), adult RTH (black circles, n = 52), and thyrotoxic (white circles, n = 11) subjects. (B) Relationship between REE and LBM in control, RTH, or thyrotoxic subjects. (C and D) Relationship between REE/LBM and fT4 (C) or fT3 levels (D) in control (n = 45), RTH (n = 46), and thyrotoxic (n = 10) subjects, excluding subjects on exogenous levothyroxine or triiodothyronine (RTH, n = 6; thyrotoxic, n = 1). (E) Relationship between mean sleeping heart rate and REE/LBM in RTH (black circles, n = 42) and thyrotoxic subjects (white circles, n = 11). Data was not available for 10 RTH subjects. (F) Correlation of the mean T3 binding affinity of the type 1 mutant TRβs with mean fT4 level in RTH subjects, excluding subjects on exogenous levothyroxine. Type 1 mutants (black circles, n = 7) follow the regression line describing this correlation; type 2 mutants (white circles, n = 3) have mutations significantly deviating from this relationship. Each data point represents mean ± SD for all subjects with that particular THRB mutation. Ka indicates the binding affinity constant of thyroid receptor (WT or mutant) for T3. (G) Correlation of mean REE/LBM with T3 binding affinity of type 1 (black circles, n = 6) and type 2 mutant TRβs (white circles, n = 3) in RTH subjects. Each data point represents mean ± SD for all subjects with that particular THRB mutation. (H) BMR expressed per unit LBM in control (gray circles, n = 22) and RTH subjects (black circles, n = 13), matched for age, gender, weight and BMI. Diagonal lines indicate the regression lines (B–G). Horizontal lines indicate the mean (A and H). r, Pearson product moment correlation coefficient.

