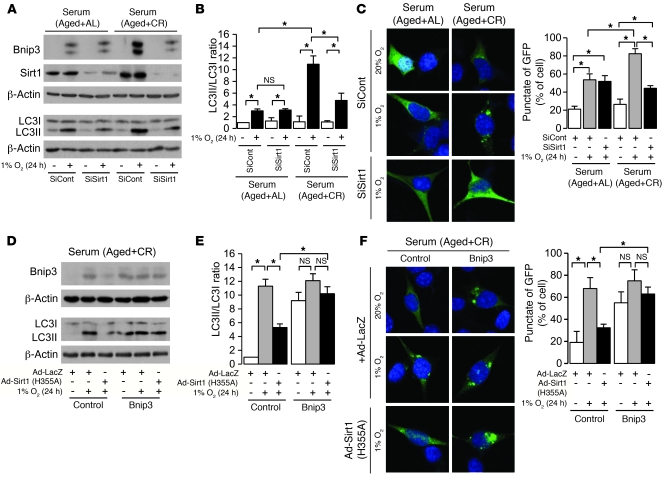
Figure 5. Involvement of Sirt1 in CR-mediated enhancement of autophagy under hypoxia.
(A) Bnip3 and Sirt1 expression and LC3II formation in retrovirally mediated Sirt1-knockdown cells under hypoxia (1% O2, 24 hours) in AL and CR serum conditions. To detect LC3I and LC3II bands, cells were preincubated with lysosomal inhibitor (E64d and pepstatin A). (B) Quantitative analysis of the ratio of LC3II to LC3I (n = 4). (C) Hypoxia-induced autophagy in Sirt1-knockdown cells under AL and CR serum conditions. Original magnification, ×400. Right: Percentage of GFP+ cells with punctate GFP-LC3 fluorescence. (D) Expression of Bnip3 and LCII formation under hypoxia in retrovirally mediated Bnip3-overexpressing cells infected with either adenoviral mutated Sirt1 (H355A) or LacZ in CR serum. To detect LC3I and LC3II bands, cells were preincubated as in A. (E) Quantitative analysis of the ratio of LC3II to LC3I (n = 4). (F) Hypoxia-induced autophagy in retrovirally mediated Bnip3-overexpressing cells infected with either adenoviral mutated Sirt1 (H355A) or LacZ in CR serum. Original magnification, ×400. Right: Percentage of GFP+ cells with punctate GFP-LC3 fluorescence. Data are mean ± SEM. *P < 0.05.

