Fig. 6.
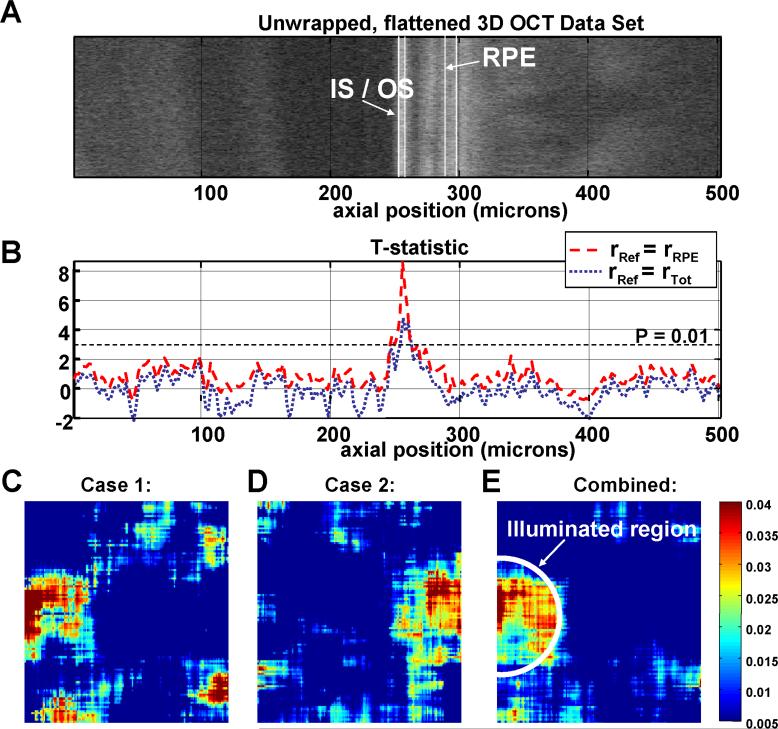
(a) An unwrapped 3D OCT data set from the parafovea, illustrating the variation in anatomy over the region scanned for the functional experiment. The data set has been flattened to the IS / OS junction. Axial position (Z) is shown in microns on the horizontal axis. (b) The t-statistic is plotted as a function of axial position using either rRef = rRPE (red dashed line) or rRef = rTot (blue dotted line). As shown, the only axial position with a high t-statistic corresponds to the IS / OS junction. (c-d) Averaged differential photoreceptor response map described in Eq. (9) is shown in colorscale. The average is performed over 8 trials (c) and 9 trials (d) to reduce noise. Median filtering of the map reduces speckle noise and noise from registration errors. (e) Because of good correspondence between the illumination location and the functional response, a combined differential map can by formed by averaging all 17 trials by flipping the differential maps from case 2 (Fig. 3(b)) so that the illuminated regions correspond. Results were obtained with protocol 1.

