Fig. 1.
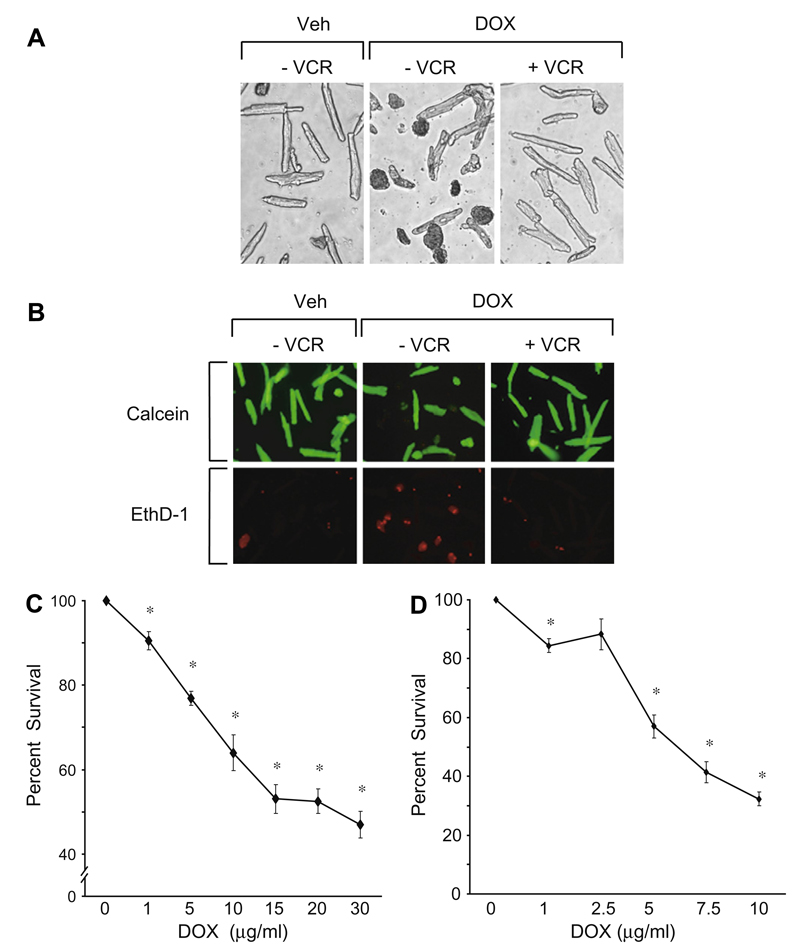
(A) Typical results of trypan blue exclusion assay in a representative experiment. Doxorubicin (15 µg/ml) treatment for 20–24 h was associated with an increased number of trypan blue positive cells and a decrease in rod-shaped cells compared to the vehicle control panel. Concurrent treatment with 10 µmol/L of vincristine was associated with a fewer trypan blue positive cells and persistence of rod-shaped cells indicating increased survival. These results were replicated multiple times. (see text and C and D and Fig. 2). VCR, vincristine; Veh, vehicle; Dox, doxorubicin. (B) Results of a Live/Dead assay. With doxorubicin (15 µg/ml) treatment alone for 24 h, there was an increased proportion of dead cells (ethidium positive/red fluorescence) and a decreased proportion of live cells (calcein ester positive/green fluorescence) compared to vehicle treatment. With concurrent vincristine treatment (10 µmol/L) there were many more live than dead cells. This experiment was replicated 4 times. VCR, vincristine; Veh, vehicle; Dox, doxorubicin; EthD-1, ethidium homodimer-1. (C, D) Time and dose dependent effects of doxorubicin on the survival of cultured adult mouse myocytes as measured by the trypan blue exclusion assay. Cell counts are expressed as the percentage relative to control values which are set at 100%. (C) Cells were treated with doxorubicin (1–30 µg/ml) for approximately 20 h. At 15–30 µg/ml, cell survival decreased by more than 50%. (D) Cells were treated with doxorubicin (1–10 µg/ml) for approximately 48 h. After longer exposure cell survival decreased significantly despite a lower concentration of doxorubicin. *p < 0.05, n = 7.

