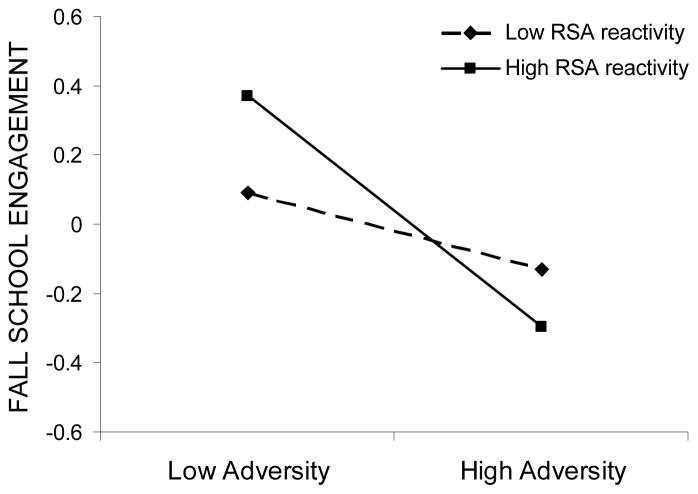
Figure 3.
Fall school engagement as a function of adversity exposure and RSA reactivity. Low and high adversity values are graphed at one standard deviation below and above the mean, respectively, whereas low and high RSA reactivity are graphed at one standard deviation above and below the residual score mean, respectively.

