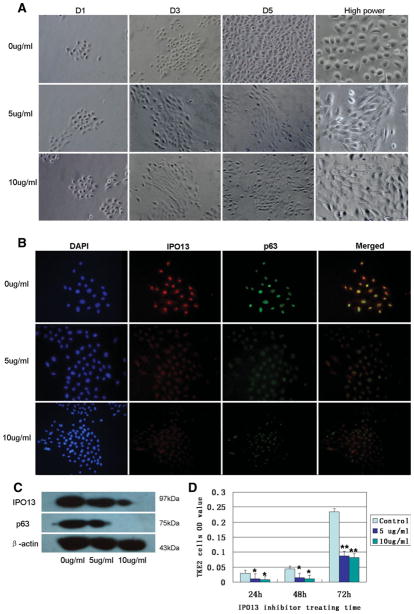
Figure 5.
TKE2 cells treated with IPO13 inhibitor. (A): TKE2 cells treated with IPO13 inhibitor at different concentrations. The cell size and shape among all groups were no any difference at D1. The cell size of TKE2 cells treated with IPO13 inhibitor changed into much bigger than that of control cells from D3. The cells became spindle shape at low concentration (5 μg/ml) and squamous shape at high concentration (10 μg/ml). (B): Immunofluorescent double staining of untreated TKE2 cells shows intensive staining for IPO13 and P63 in nuclei; both have similar expression patterns. However, TKE2 cells treated with IPO13 inhibitor show downregulated expression of IPO13 and P63 depending on concentration. (C): Western blotting assay. The expression of IPO13 and P63 were downregulated in TKE2 cells treated with IPO13 inhibitors depending on concentration. There were low levels of expression of IPO13 and no expression of P63 at high concentration. (D): MTT assay of TKE2 cells treated with an IPO13 inhibitor. The proliferative capacity of TKE2 cells treated with IPO13 inhibitor decreased significantly depending on concentration and treating time compared with normal controls. *, p < .05. **, p < .01 (compared with controls). Original magnification: ×200; high power: ×300.

