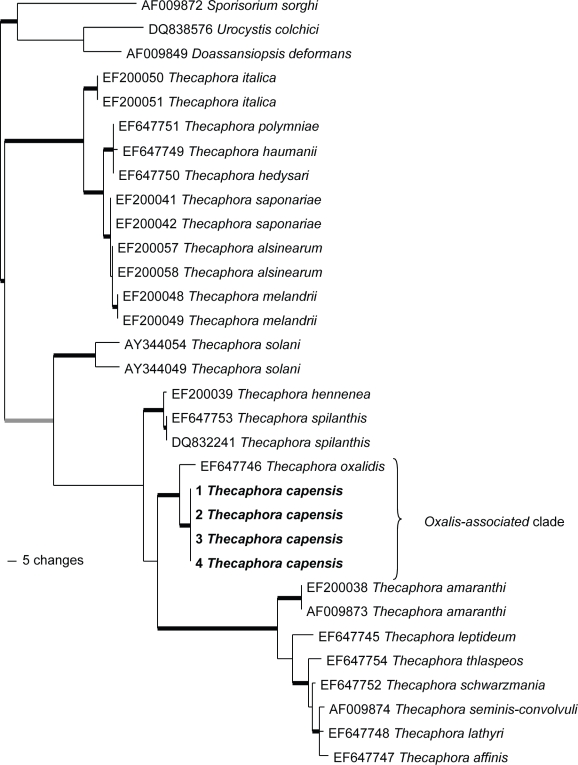
Fig. 1.
One of four trees resulting from parsimony analysis of Thecaphora and closely related species, based on sequence data from the large subunit rDNA region. Thickened black lines indicate groups with strong support in all analysis (parsimony bootstrap > 80; Bayesian posterior probability > 0.95; Maximum likelihood bootstrap > 80). Thickened grey lines indicate groups with strong support using model based methods and moderate support for parsimony analysis (parsimony bootstrap between 70 and 80).

