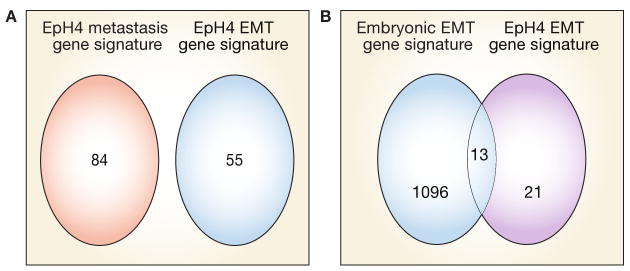
Figure 4.
Overlap between the EMT gene signature of EpH4 mammary cells and that of the embryonic palate. (A) A Venn diagram illustrating the overlap between the gene signature of EpH4 metastasis and the gene signature of EMT in EpH4. Both upregulated and downregulated genes are represented. These results show that EMT can be distinguished from metastasis as a molecular process. (B) A Venn diagram showing the number of upregulated EMT-specific genes in EpH4 cells that are also upregulated or downregulated by at least twofold in the embryonic palate undergoing EMT. Both EMT processes are in response to TGF-β1. Approximately 50% of EMT-specific genes upregulated in EpH4 cells are also upregulated during EMT associated with embryonic palate morphogenesis. Based on data from Jechlinger M et al. (2003) Oncogene 22: 7155–7169, and LaGamba D et al. (2005) Dev Dyn 234: 132–142. Abbreviation: EMT, epithelial–mesenchymal transition.

