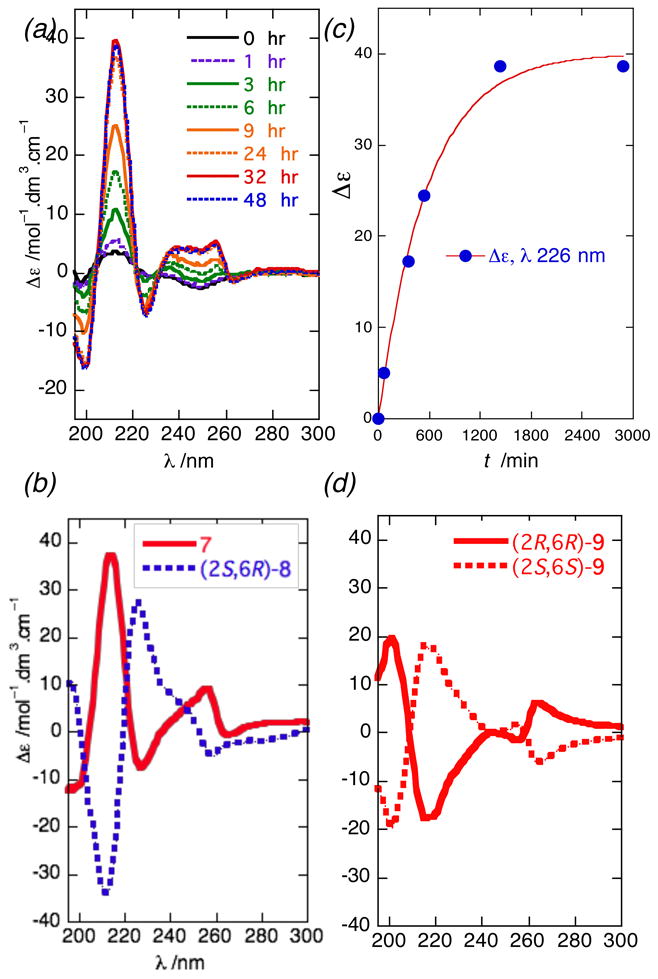
Figure 2.

Liposomal circular dichroism (L-CD) spectra (T= 23 °C). (a) 7 from t = 0 to 48 hrs after formulation of liposomes (H2O, diastearoyl-sn-3-glycero-phosphocholine, 2 mg/mL; mole ratio of phospholipid:7 = 20:1). (b) 7, c = 2.24 × 10⁻⁴ M and (2S,6R)-8, c = 2.25 × 10⁻⁴ M. (c) Time-dependence of the Cotton effect of 7 (λ = 226nm), post-formulation. (d) (2R,6R)-9, c = 2.47 × 10⁻⁴ M and ent-9 (calculated).
