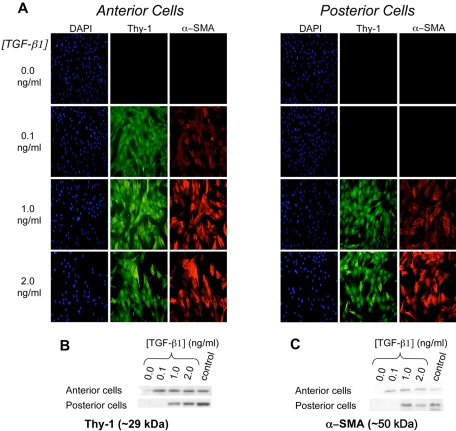
Figure 2.
Isolated anterior and posterior keratocytes cultured in different concentrations of TGF-β1. (A) Immunofluorescence staining of DAPI (blue), Thy-1 (green), and α-SMA (red). (B) Western blot demonstrating posterior cells required higher concentrations of TGF-β1 than anterior cells for Thy-1 expression (1 vs. 0.1 ng/mL TGF-β1, respectively). (C) Western blot demonstrating posterior cells required higher concentrations of TGF-β1 than anterior cells for α-SMA expression (1 vs. 0.1 ng/mL TGF-β1, respectively).

