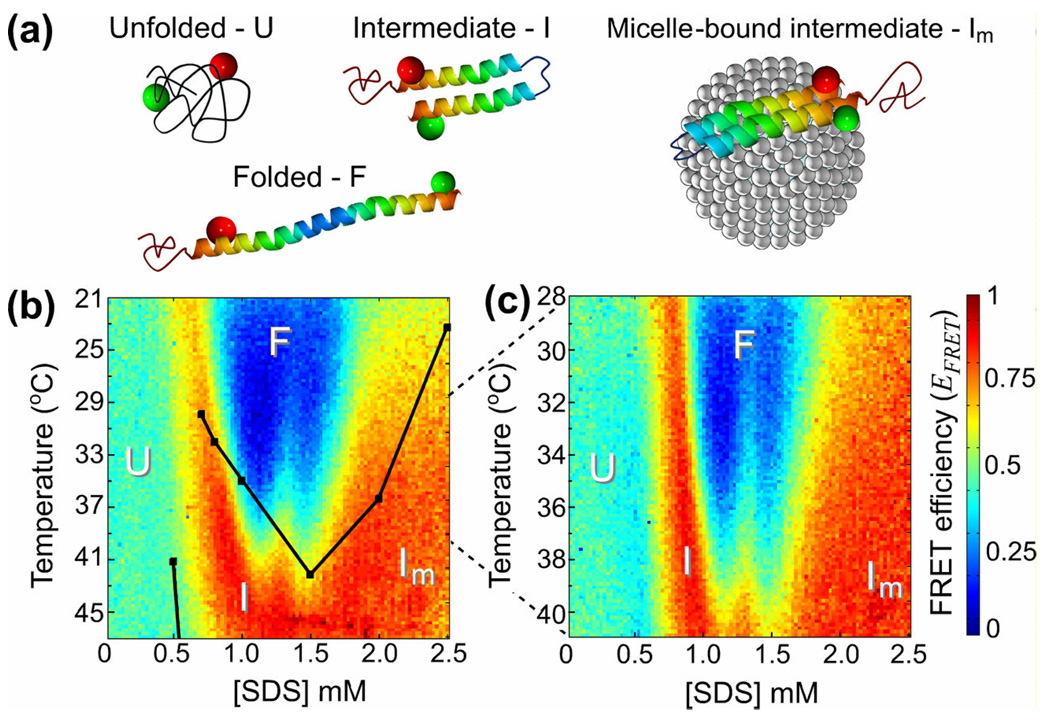
Figure 3.
(a) Schematic drawings of various conformational states of α-synuclein with a micelle bound to it in the Im state. Green and red spheres indicate the fluorescent dyes, Alexa 488 and 594, respectively. (b)–(c) Color-coded diagrams of apparent FRET efficiency, EFRET, as a function of SDS concentration, [SDS], and temperature, with the protein conformations, U, I, F, and Im, assigned to different domains. Black dots in (b) designate the 50% two-state transition midpoints between different states from temperature ramp experiments in Ref. 8. The dots are connected by lines to guide the eye. The temperature range in (c), 28 – 41°C, is half as broad as in (b), 21 – 47 °C.

