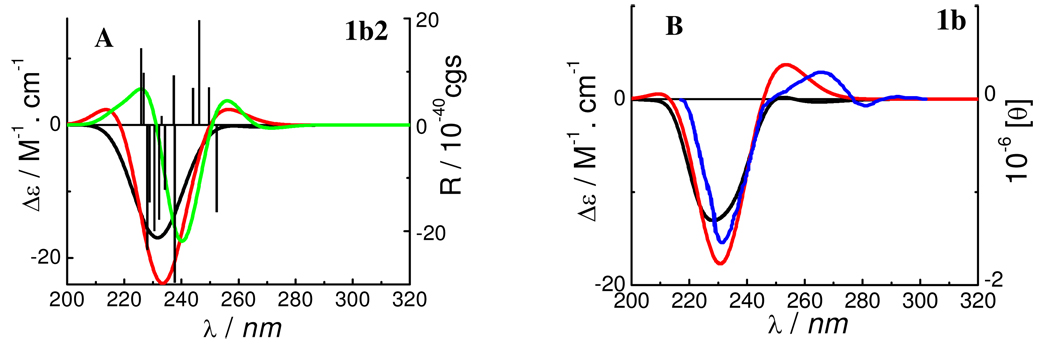
Figure 2.
Calculated ECD spectra of conformer 1b2 (A) and weighted and experimental ECD spectra of compound 1b (B). (— and  : at the B3LYP/6–31G* and B3LYP/6–311++G**//B3LYP/6–31G* levels in the gas phase, respectively;
  : at the B3LYP-SCRF/6–31G*//B3LYP/6–31G* level with the COSMO model in MeOH;
  : the experimental ECD spectrum in MeOH).

