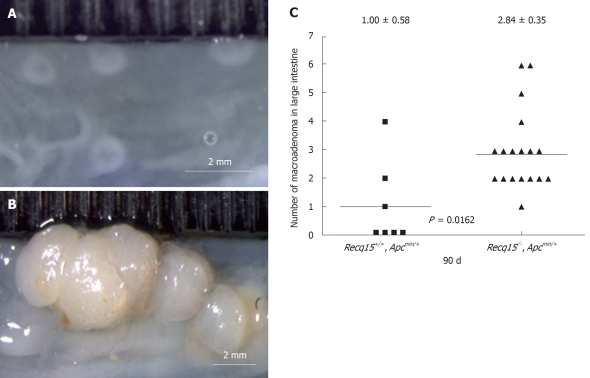
Figure 2.
Effects of Recql5 deficiency in the development of colonic adenomas in the ApcMin/+ mice. A, B: Representative images of sections from the colon of a Recql5+/+ApcMin/+ (A) and a Recql5-/-ApcMin/+ (B) mouse. Note that A and B are shown at different magnifications. B is shown at a lower magnification in order to show a similar whole view of the interior of the lumen that was significantly enlarged by the presence of the multiple tumors; C: Numbers of colon macroadenomas. The horizontal bars indicate the mean numbers of adenomas in each population. Mean and SE are also shown at the top of each column. Each data point represents the total number of colonic tumors in a single mouse.

