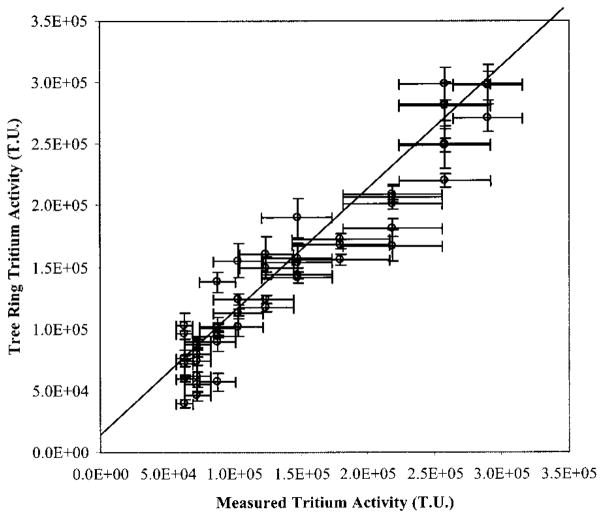
FIGURE 6.
Correlation of tritium levels measured in water pumped into the unlined ditch compared with organically bound tritium levels measured in the annual rings of a Tamarix from 1982 to 1992. Y-error bars represent the tritium AMS uncertainty based on counting statistics, internal variability from multiple measurements, and variability of external standards. X-error bars represent the range of tritium levels measured in the pumped water over the calendar year.

