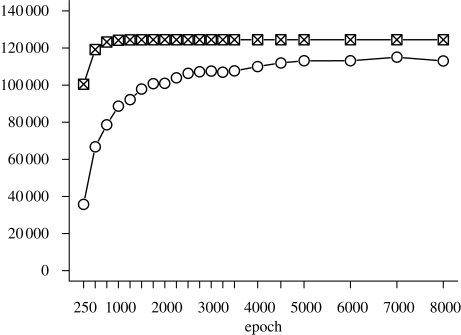
Figure 4.
Simulated phonological vocabulary learning (Simulation 1, Gupta & Tisdale 2009). The y-axis shows the number of words that have been presented at least once, and the number of words that are correctly produced. Crosses, presented; open circles, correct.

