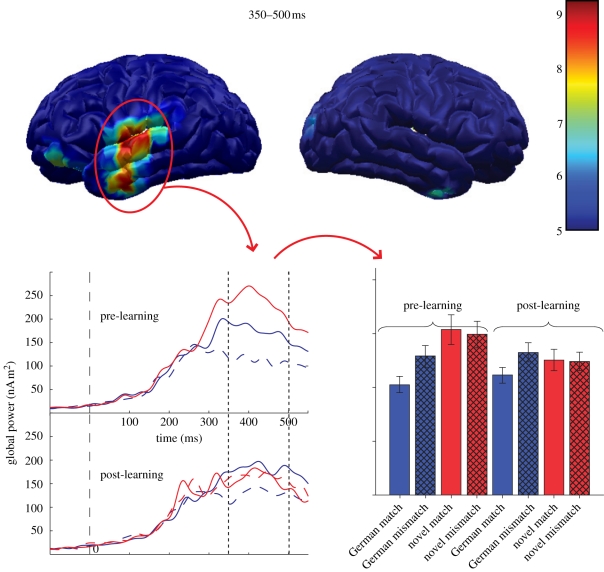
Figure 3.
Top of figure displays the statistical parametric F-values of the effect MATCH for German, mapped on a standard cortical surface and averaged between 350 and 500 ms. The difference between matches and mismatches can be clearly seen over the left temporal gyrus. Left bottom of figure displays the time course of activity for this region (for the visual display data were low-pass filtered with 30 Hz). Right bottom figure shows the MNLS values over the left temporal area, broken down by session, language and match (left: pre-training; right: post-training; blue: German; solid: match; hatched: mismatch; red: novel; error bars denote standard errors).

