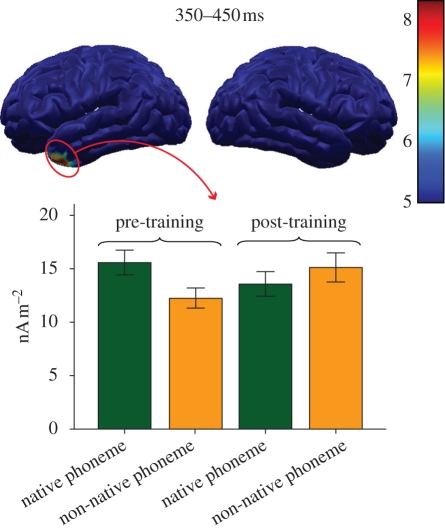
Figure 4.
Top of figure displays the statistical parametric F-values of the effect SESSION × PHONEME mapped on a standard cortical surface and averaged between 350 and 450 ms. Bottom figure shows the MNLS values over the left temporal area, broken down by session and phoneme (left: pre-training; right: post-training; green: native, yellow: non-native; error bars denote standard errors).

