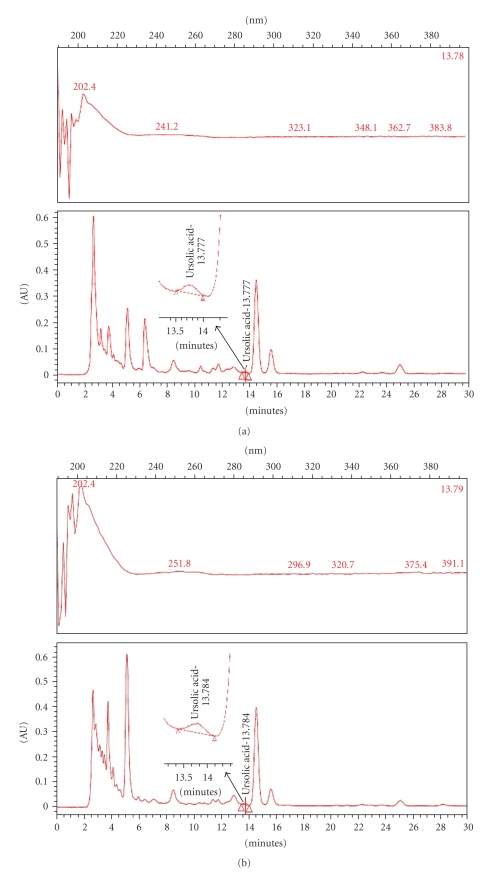
Figure 7.
HPLC (high performance liquid chromatography) fingerprint of ethanol extract and its CH2Cl2 fractions. A. koreanum ethanol extract (a) and its CH2Cl2 fractions (b) were analyzed by HPLC. The lower side (c) represents standard ursolic acid. Ursolic acid exhibits peak absorbance at 203-204 wavelength.


