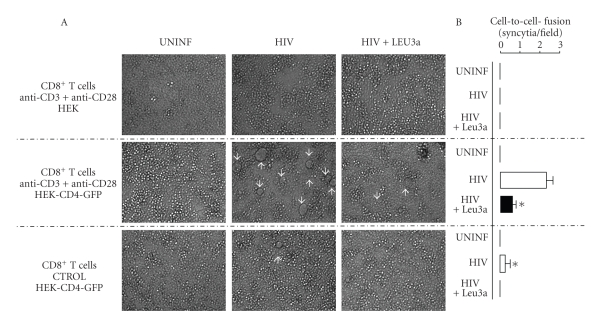
Figure 4.
CD8+ T cells having acquired CD4 induced syncytia formation in infected MOLT-4 cultures. (A) Transmission microscopy analysis (low power fields) of cultures in which anti-CD3 + anti-CD28-activated CD8+ T cells that had been cocultured with HEK cells either expressing CD4-GFP (middle and lower panels) or not (upper panels), were then mixed with uninfected MOLT-4 cells (left panels) or HIV-infected MOLT-4 cells either in the absence (middle panels) or the presence (right panels) of the anti-CD4 mAb Leu3a. The controls shown on the bottom panels correspond to T cells that have been cocultured with HEK cells expressing CD4-GFP, but had not previously been activated with the anti-CD3 + anti-CD28 mAbs, (CTROL) white arrows indicate the positions of syncytia. (B) Quantification of syncytia in different randomly selected high power fields. Data are mean ± SD values of at least four different fields. Note that syncytia formation was never detected when uninfected MOLT-4 cells were used, whatever the condition tested. Asterisks denote statistically significant differences between activated and control CD8+ T cells cocultured with HEK-CD4-GFP cells (P = .002, T test) and significant inhibition was induced by Leu3a (P = .001, T test).

