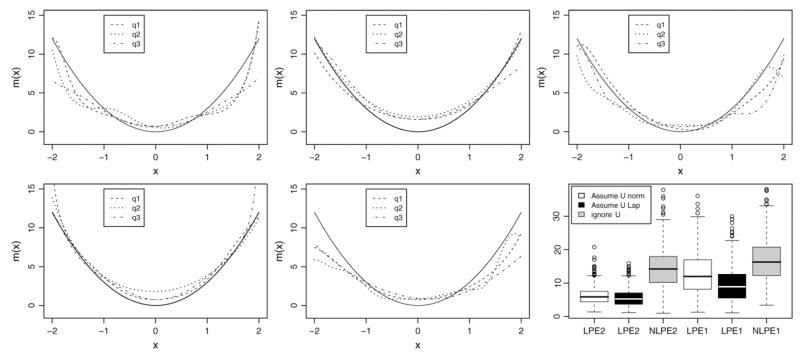
Figure 3.
Estimates of the derivative function m(1) for case (3) when U is normal with var(U) = 0.4var(X) and n = 500, using our local linear method (LPE1, top left) and local quadratic method (LPE2, top center) assuming that U is normal, using the LPE1 (top right) and LPE2 (bottom left) wrongly assuming that the error distribution is Laplace, or using the NLPE2 (bottom center). Boxplots of the ISEs (bottom right). Data are averaged replicates and var(U) is estimated by (10).

