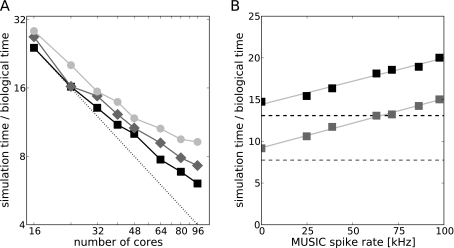
Fig. 11.
Performance of the symmetric multi-simulation benchmark. a Simulation time per second of biological time as a function of the total number of compute cores for both network models. Black squares show the performance of the control (NMUSIC = 0), dark gray diamonds the benchmark’s performance for NMUSIC = 8 and light gray circles for NMUSIC = 8,000. The dotted line indicates the expectation for linear speed-up of the control. b Simulation time per second of biological time as a function of the MUSIC spike rate. Simulations with 32 cores are indicated in black, with 64 cores in dark gray. Dashed lines indicate the control (NMUSIC = 0) and squares show the data for the symmetric multi-simulation benchmark with light gray lines showing the corresponding linear fits

