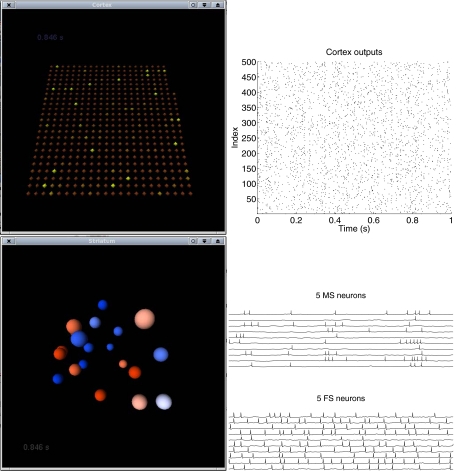
Fig. 13.
Results from the multi-simulation described schematically in Fig. 12. To the left, two window captures from 3D visualizations of the cortex and striatum model are shown. In the upper half of the figure, 500 outputs from the cortex model in NEST are visualized on a planar grid, the radii and intensity of the color of the neurons increase when they spike. In the lower part, 10 MS (red) and 10 FS (blue) neurons in the striatal network are visualized in the same manner. To the right are a raster plot of the cortical activity and voltage traces for the MS and FS neurons

