. Author manuscript; available in PMC: 2010 Jul 1.
Published in final edited form as: Nat Neurosci. 2009 Dec 6;13(1):84–88. doi: 10.1038/nn.2449

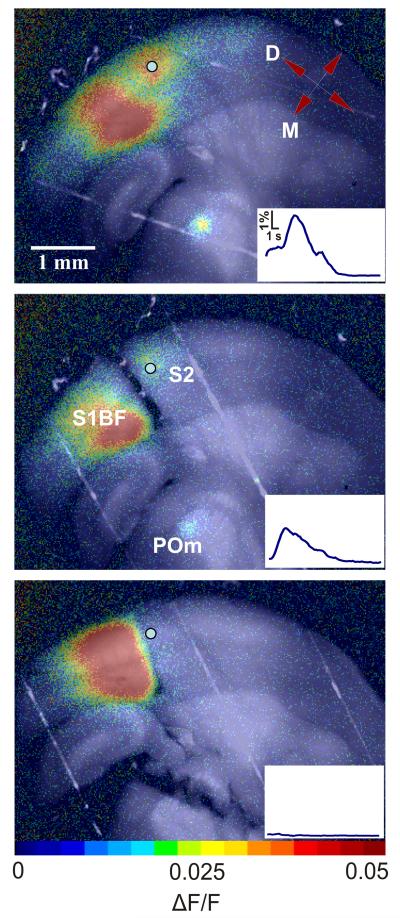
Figure 2.

Figure 2

Demonstration of corticothalamocortical pathway sufficiency to drive secondary somatosensory cortex activity: electrical stimulation. Panels are ΔF/F (change in fluorescence/baseline fluorescence) images overlaid on top of raw images for anatomy. Insets are optical traces for the region delineated by the blue circles in secondary somatosensory cortex. Panels A–C depict a ‘cut sequence’ experiment. 1/1 experiments shown.
  1. Secondary somatosensory cortex response to S1BF stimulation in a somatosensory slice preparation.
  2. Secondary somatosensory cortex response following a cut between S1 and secondary somatosensory cortex. ΔF/F decreased by 45.5% in secondary somatosensory cortex and 11.6% in POm compared to baseline (a).
  3. Cortical response following thalamic ablation. See Supplementary Video 1 online. ΔF/F decreased by 81.6% in secondary somatosensory cortex and 92.7% in POm compared to baseline (a).