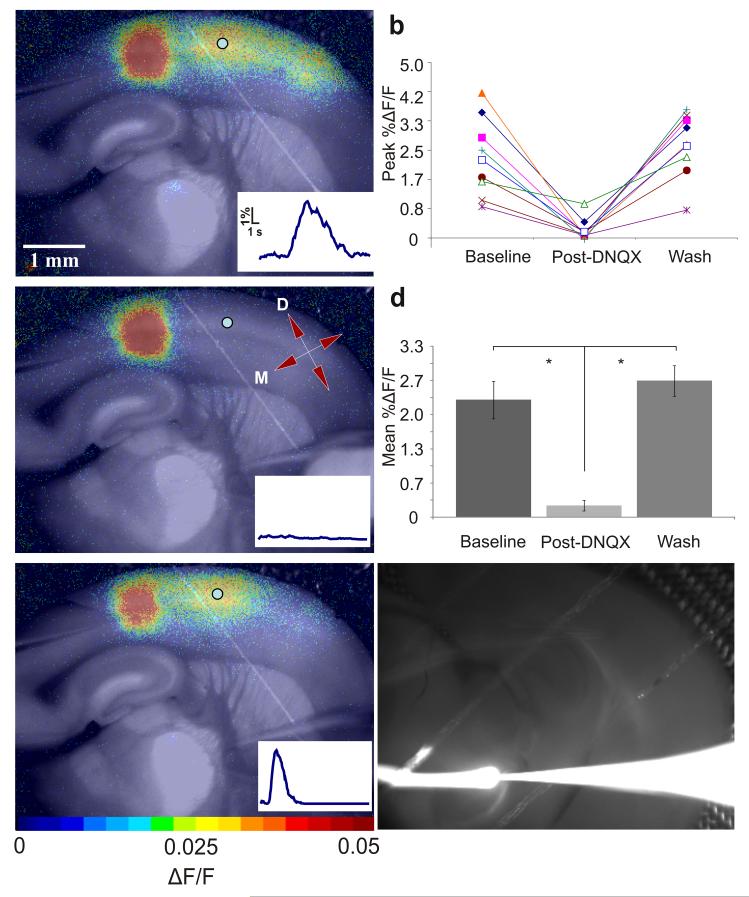
Figure 3.
- Stimulation of layer 5B of S1BF via microspritzing of glutamate (see Methods).
- Maximum percent ΔF/F before, during, and after DNQX – all Runs. 5×5 regions of interest were chosen in secondary somatosensory cortex for each trial. These regions were analyzed to determine maximal ΔF/F values during the baseline run (before DNQX), post-DNQX run and washout. Values for all nine experiments are plotted.
- Slice response to the same stimulus as (a) ~4 minutes after local application of 500μM DNQX in the thalamic hotspot. Directional axis: D = dorsal, M = medial. In d, color bar corresponds to colors in panels.
- Mean percent ΔF/F before, during, and after DNQX inactivation of thalamus. The data shown in (b) were averaged and compared using a two-tailed t-test (an asterisk indicates a significant difference; see Results and Methods). Error bars indicate s.e.m. Means and standard errors were the following: 2.29 +/− 0.36% before DNQX, 0.2 +/− 0.10% Post-DNQX, 2.66+/− 0.30% Wash.
- Response after DNQX washout. See Supplementary Video 2 online.
- Injection spread control. We injected a fluorescent tracer into the thalamus using the same paradigm we used while injecting DNQX. The white line extending left from the electrode tip represents the tracer stream. ACSF flowed from right to left. See Supplementary Video 3 online.

