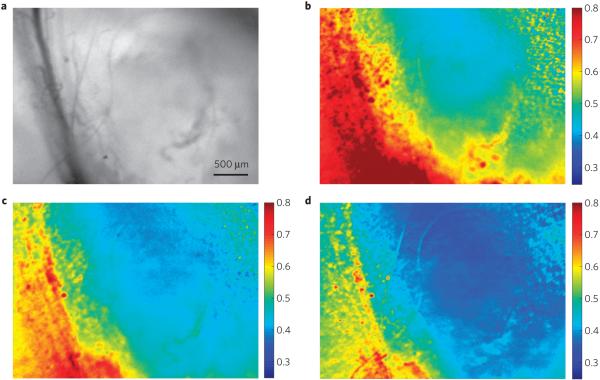
Figure 3. Tumour hypoxia imaging with P2 BF2dbm(I)PLA nanoparticles.
a-c, In vivo imaging of the breast cancer 4 T1 mammary carcinoma tumour region in a mouse window chamber model showing the bright-field (a) and BNP fluorescence/phosphorescence ratio while breathing carbogen—95% O2 (b), room air—21% O2 (c) and nitrogen—0% O2 (d). Emission intensity was averaged from 430 to 480 nm (fluorescence) and 530 to 600 nm (phosphorescence). Several blood vessels run vertically on the left side of the images (dark lines in the bright-field image; more oxygenated yellow-red regions in the fluorescence/phosphorescence images), with the tumour comprising the region to the right of the vessels (less-oxygenated blue regions in the fluorescence/phosphorescence images).

