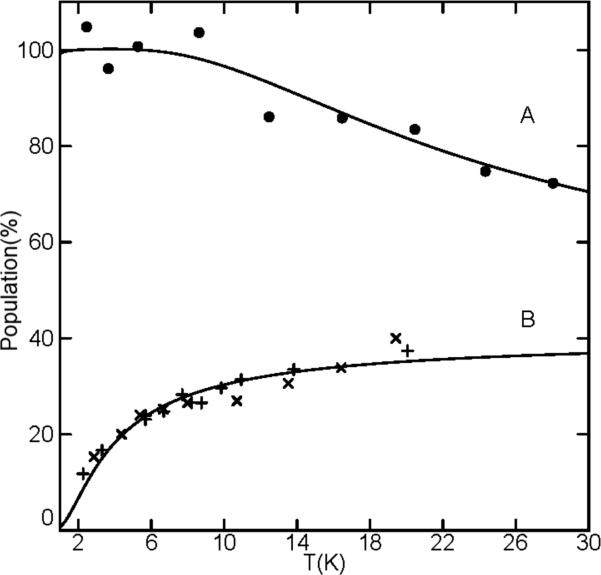
Figure 5.
The temperature dependence of the EPR signals of (A) K(222)[Fe(OEP)(2-MeIm−)], (B) [Fe(TPP)(2-MeHIm)] (x), and (B) [Fe(TPP)(2-MeHIm)]2·2-MeHIm (+) plotted as signal amplitude times temperature. The theoretical curves are the percent populations of an S = 2 (E/D = 0.1) system for (A) the lowermost doublet with D = −8cm−1, and (B) the uppermost doublet with D = +0.9 cm−1. Estimate of D-value of [Fe(TPP)(2-MeHIm) complex from the temperature dependence of the EPR signal.

