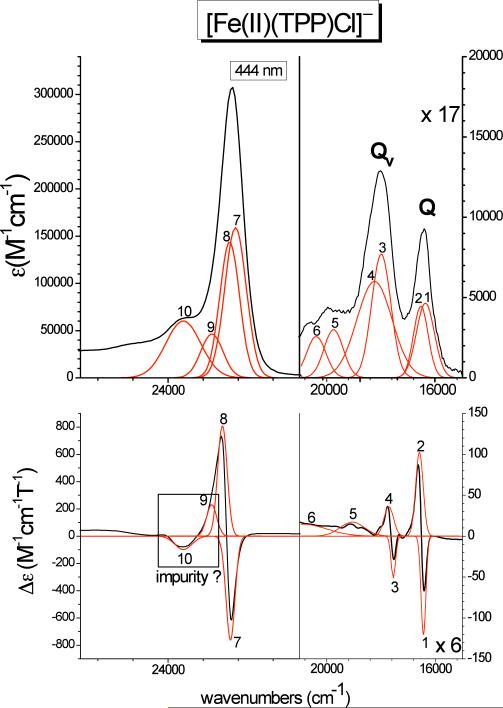
Figure 8.
Electronic spectra of [Fe(TPP)Cl]− (class A). Top: UV-Vis spectrum measured in CH2Cl2 at room temperature. Bottom: MCD C-Term spectrum measured in toluene/CH2Cl2 (1:1) at 2 K. The red lines represent a correlated fit of these data (cf. Table 3-C).

