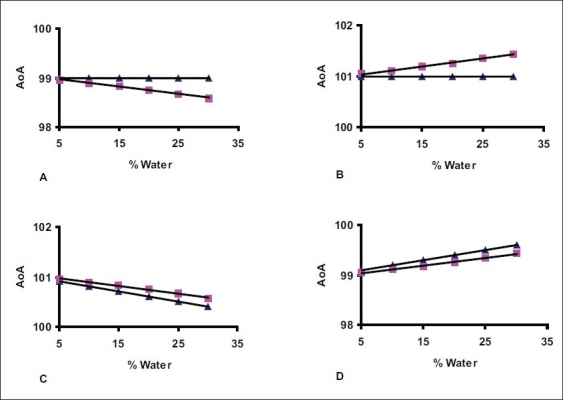
Fig. 1.

Plot of % AoA verses % Water content.
The plots A, B and C, D represents constructive and destructive error of propagation, respectively. ▪ = AoAa, ▲ = AoAp

Plot of % AoA verses % Water content.
The plots A, B and C, D represents constructive and destructive error of propagation, respectively. ▪ = AoAa, ▲ = AoAp