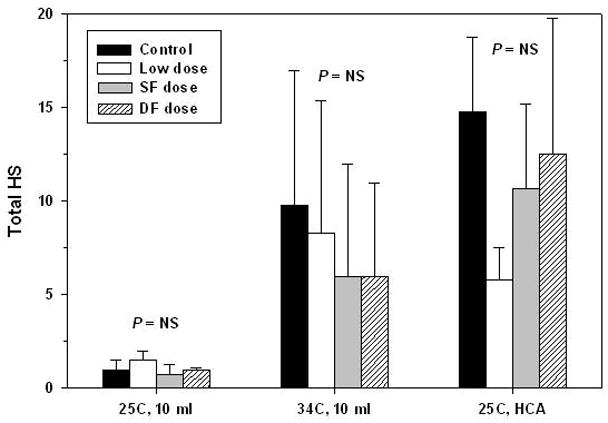
Figure 7.

Total histologic scores according to aprotinin dose for the three bypass conditions. ANOVA with Bonferroni comparisons revealed no significant differences in total HS between the four groups (control and aprotinin doses) for any of the bypass conditions (25°C, 10 mL, P = .12; 34°C, 10 mL, P = .82; HCA, P = .10). Error bars denote standard deviations. NS = not significant.
