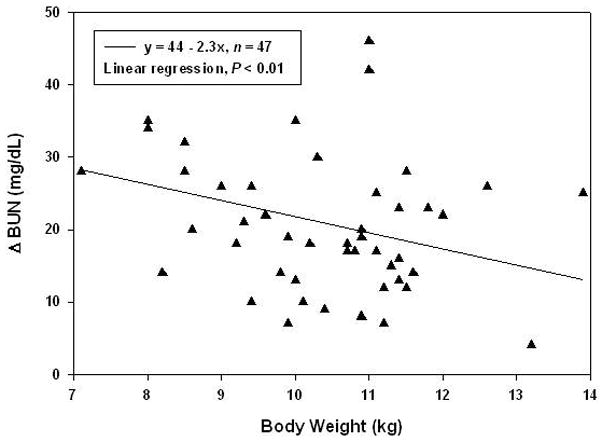
Figure 9.

Inverse relationship between body weight and change in BUN (r = −0.39, n = 47). Linear regression analysis indicates that lower body weight was predictive of a greater increase in BUN at POD1 (P < .01) and that this relationship is independent of aprotinin dose and bypass conditions. For example, a piglet weighing 9 kg is expected on average to increase in BUN by 24 mg/dL, whereas a 13 kg piglet is expected to increase by 14 mg/dL. The solid line represents the fitted regression line, where x is body weight in kg.
