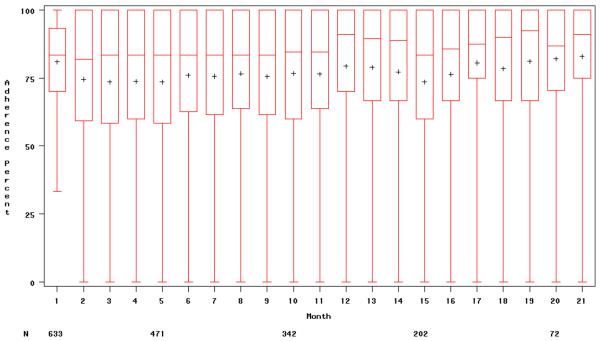
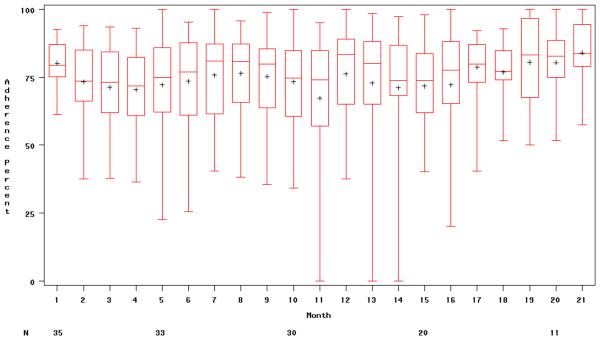
Figure 1.
Adherence by resident time in study (1a) and nursing home time in study (1b). The box indicates the interquartile range (25th-75th percentile); the plus sign inside of the interquartile range represents the mean; the line inside of the interquartile range represents the median; and the line extending from the box represents the extreme value.


