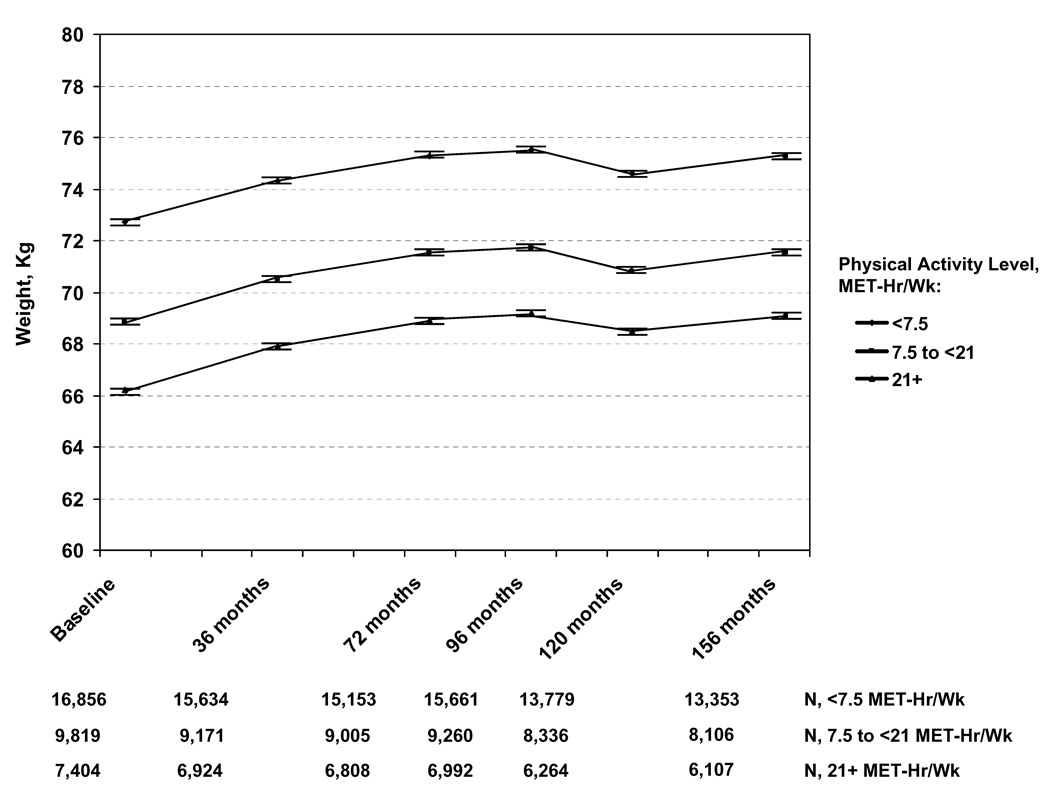
Figure 2.
Mean Weight,a according to Baseline Physical Activity Levels,b over Study Duration, Women’s Health Study
Numbers below the x-axis indicate the number of women contributing data to each time period.
a Vertical bars represent 95% confidence intervals.
b See footnote to Table 1 regarding physical activity levels.

