Fig. 1.
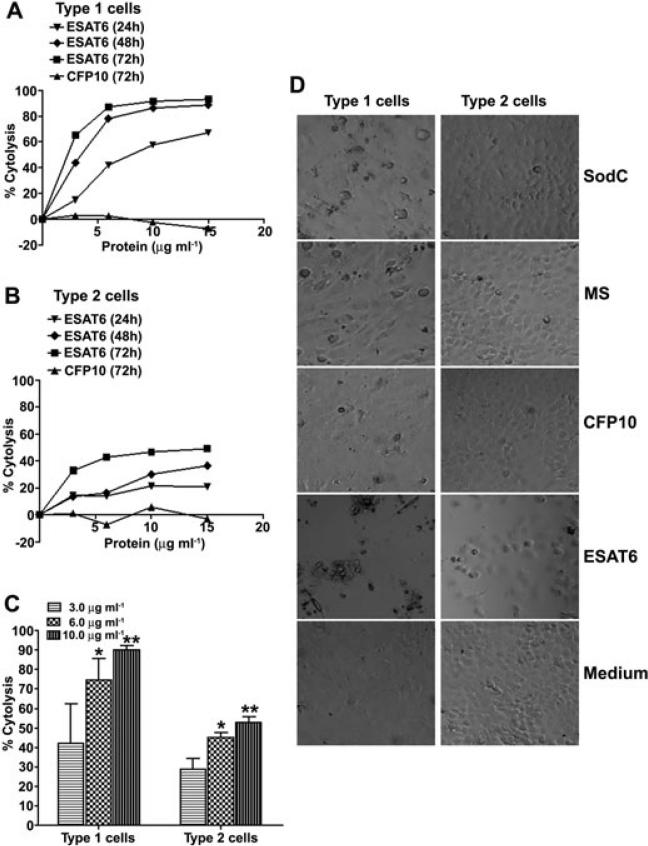
ESAT6 causes dose- and time-dependent cytolysis of type 1 and 2 pneumocytes.
A and B. (A) Type 1 pneumocytes (WI26 cells) and (B) type 2 pneumocytes (A549 cells) were incubated with several concentrations of ESAT6 or CFP10 for 24, 48 and 72 h at which time MTT assay was performed to quantify lysis. Cells exposed to medium alone were used as controls; each assay condition was tested in six wells. Per cent cytolysis was calculated by using the formula: (Mean OD530 of 6 control wells – Mean OD530 of 6 test wells)/(Mean OD530 of 6 control wells) × 100. For CFP10, only results obtained at 72 h are shown. These assays were done atleast 3 times and a single representative assay with each cell line is shown.
C. Type 1 pneumocytes are significantly more sensitive to ESAT6-mediated cytolysis than type 2 pneumocytes at 6 μg ml–1 (*P = 0.0098) and 10 μg ml–1 (**P = 0.0005) of ESAT6. Per cent cytolysis obtained after 72 h of incubation of the two cell lines with different concentrations of ESAT6 is plotted. Values are mean percentage cytolysis ± SD from at least three independent experiments.
D. Microscopic visualization of cytolysis of type 1 and 2 pneumocytes when exposed to 10 μg ml–1 M. tb proteins for 72 h. Cells were visualized using a Nikon microscope at 100× magnification. Photographs shown are digitally magnified to show the monolayers.

