
Figure 1.
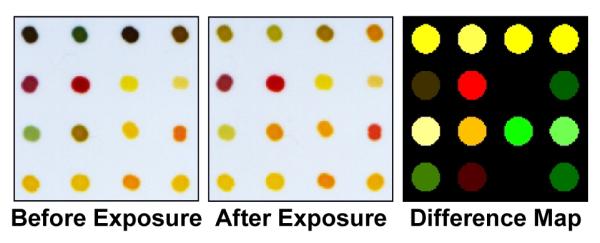
Digital images of the colorimetric sensor array before and after 5 min. exposure to 25 mM D-fructose. Subtraction of the two images (red minus red, green minus green, blue minus blue) yields a difference vector (right) in 48 dimensions. For display purposes only, the color range of the difference map has been expanded from 5 to 8 bits (i.e., an RGB range of 4-35 is shown expanded to 0-255).