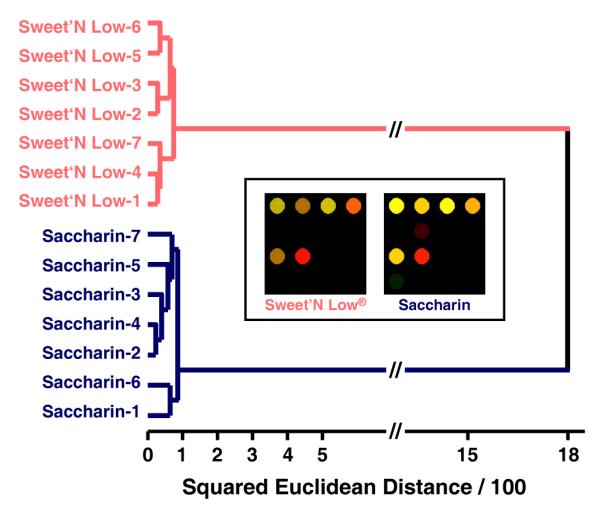
Figure 6.

Hierarchical cluster analysis and color difference maps (inset shows averages) of septuplicate trials of two saccharin solutions, one made using Sweet’N Low® brand sweetener (1 individual serving packet) and the other using the same amount (36 mg) of pure saccharin from Aldrich. Each was dissolved in 4 oz of weakly buffered 5 mM 3-nitrophenylboronic acid solution (pH 7.45) and scanned after 5 minutes. The color range is expanded from 4 to 8 bits per color (RGB range of 3-18 expanded to 0-255).
