
Figure 9.
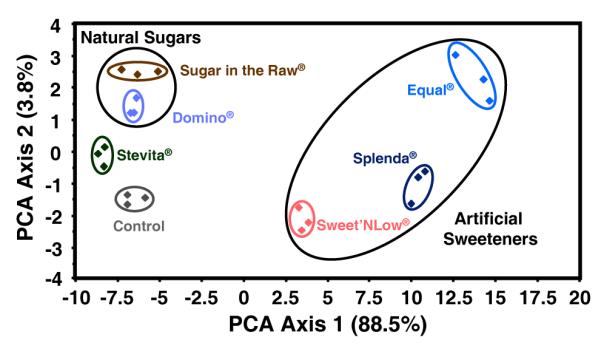
Principal components analysis score plot for 6 commonly used natural and artificial sweeteners. Interestingly, two obvious patterns emerge: (1) the close relationship among natural sugars, and (2) the proximity of all three “artificially produced” sweeteners. Experiments were run in triplicate.