Fig. 5.

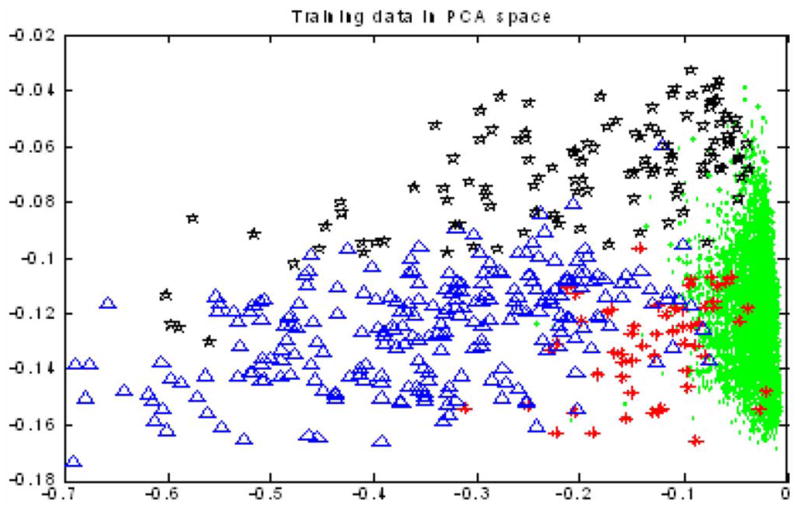
2-D visualization of all the 9600 nuclei in the training dataset. Green spots—interphase; red stars—prophase; blue triangles—metaphase; and black pentacles—anaphase.

2-D visualization of all the 9600 nuclei in the training dataset. Green spots—interphase; red stars—prophase; blue triangles—metaphase; and black pentacles—anaphase.