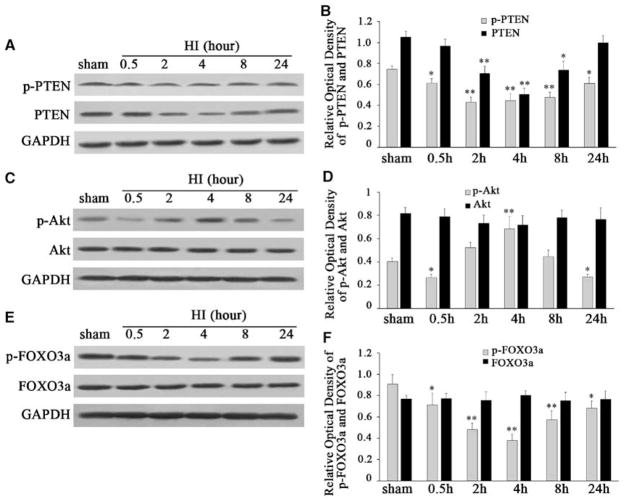
Figure 2.
Western blot analysis of the expression and phosphorylation of PTEN, Akt, and FOXO3a in the hypoxic–ischemic cortex of P10 rats after HI (A, C, and E). One band at 54 kDa corresponding to the p-PTEN protein significantly decreased at 0.5 h, reached the lowest at 2 h, and maintained at 4 h, started to recover but still remained at a low level at 8 and 24 h compared with that of sham controls (panel A). PTEN was not changed at 0.5 h, but remarkably decreased at 2 h, reached the lowest at 4 h, started to recover at 8 h, and returned to baseline at 24 h after HI, compared with that of sham controls (panel A). One band at ~60 kDa corresponding to the p-Akt protein decreased at 0.5 h, transiently induced at 4 h, returned to baseline at 8 h, and declined again at 24 h after HI, compared with that of sham controls (panel C). However, total Akt remained unchanged at different time points (panel C). One band at ~97 kDa corresponding to p-FOXO3a significantly decreased at 0.5 and 2 h, reached the lowest at 4 h, started to recover, but still remained at a low level at 8 and 24 h compared with that of sham controls (panel E). However, total FOXO3a was not obviously changed at the indicated time points (panel E). Quantification of PTEN, p-PTEN, Akt, p-Akt, FOXO3a, and p-FOXO3a expression in the HI group and in sham controls (B, D, and F). Data were obtained by densitometry and were normalized using GAPDH as loading control. Values are expressed in relative optical density and are represented as mean±s.d. For each column, n=5, *P<0.05, **P<0.01 versus that of sham controls. (HI, hypoxia–ischemia).

