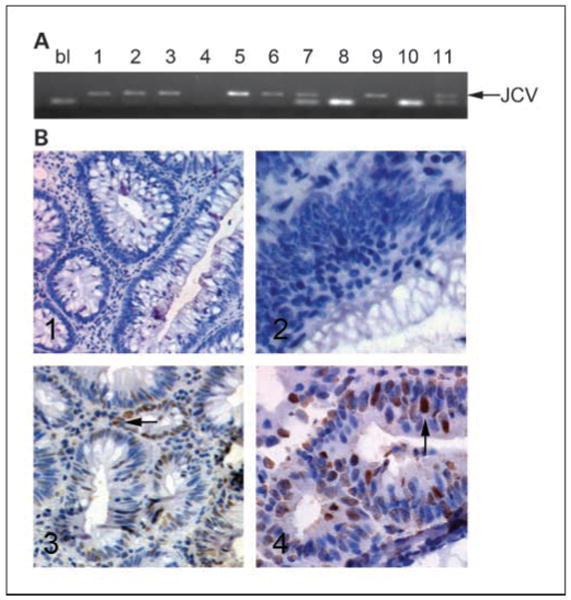
Fig. 1.

PCR amplification of JCV TAg DNA sequences (A) and expression of JCV TAg in adenomatous polyps. A, example of PCR amplification of JCV TAg DNA. Arrow, size of the JCV TAg DNA fragment. 1 to 4, control adenomas; 5 to 7, LTR adenomas; 8 and 9, control normal mucosa; 10 and 11, LTR normal mucosa; bl, blank (water control). B, immunohistochemistry showing samples positive and negative for JCV TAg protein. Samples 1 and 2 (corresponding to samples 1 and 2 in A) are adenomas obtained from controls, whereas samples 3 and 4 (corresponding to samples 5 and 6 in A) are adenomas obtained from LTRs. Arrow in sample 5, positive staining; arrow in sample 6, positive nuclear staining for JCV TAg.
