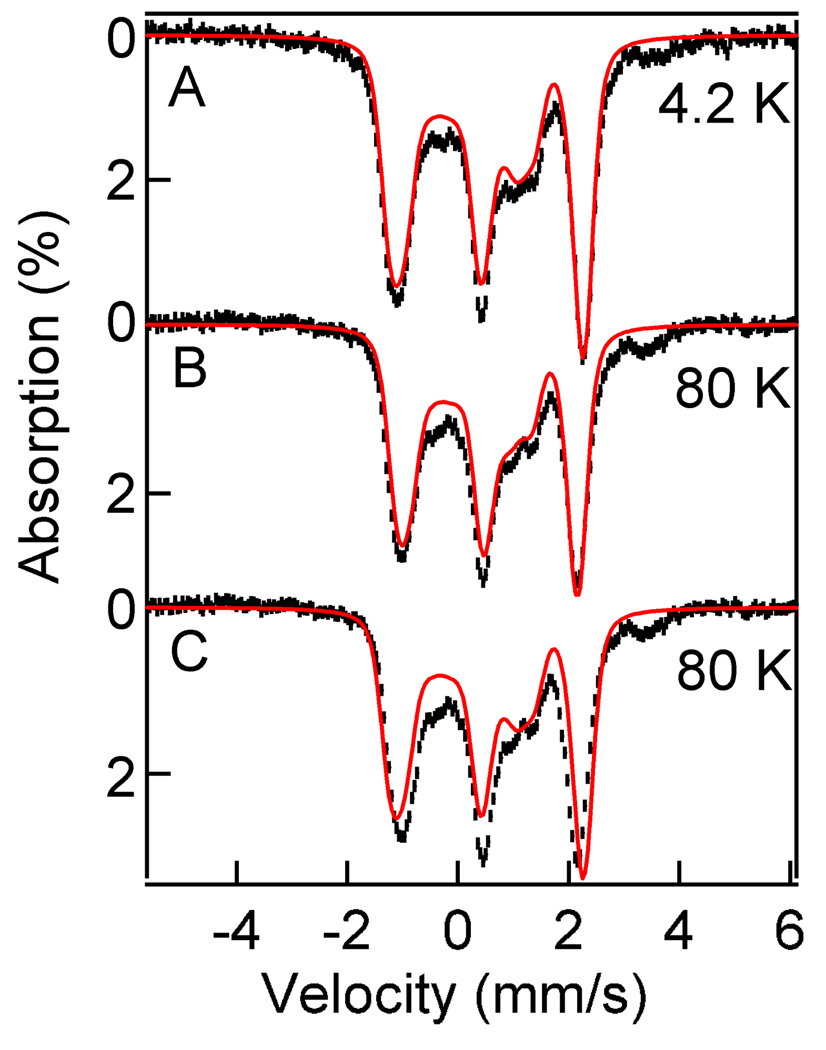
Figure 7.
8.0 T Mössbauer spectra of 2•O2PPh2 in CH2Cl2 recorded at 4.2 K (A) and 80 K (B). The solid red lines are theoretical curves using the parameters listed in Table 3. The data in shown (C) are the same as in (B); the solid red line in (C) is a simulation obtained by assuming (wrongly) that only the S= 0 ground state is occupied at 80 K (2Spin simulation for J = 1000 cm−1). The solid red line in (B) was obtained for J = 57 cm−1 (alternatively, one can simulate the spectrum by assuming a state with S = 0 and adjust the applied field to B = 7.35 T).

