
Figure 1.
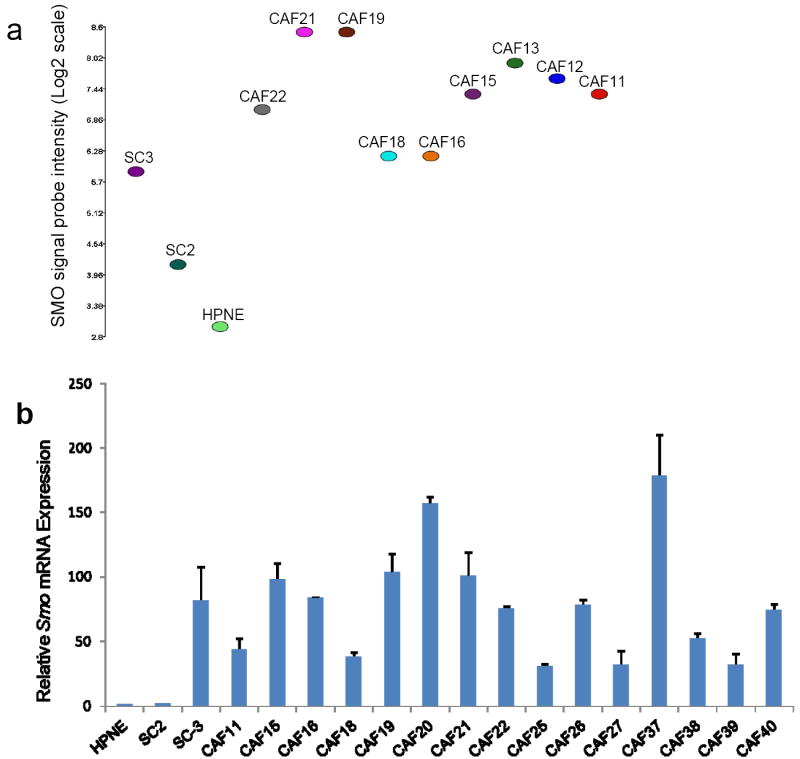
Analysis of Smo mRNA expression in fibroblast cultures. (a) Affymetrix exon array analysis of Smo mRNA expression in fibroblast cultures established from chronic pancreatitis tissue (SC3), IPMN tissue (SC2), normal pancreas (HPNE), and primary pancreatic adenocarcinomas (CAFs). Relative Smo expression values were obtained after using the Robust Multichip Average (RMA) method to normalize the raw intensity measurements of all probe sets. (b) Quantitative RT-PCR analysis of Smo mRNA expression in fibroblast cultures established from normal pancreas (HPNE), IPMN tissue (SC2), chronic pancreatitis tissue (SC3), and primary pancreatic adenocarcinomas (CAFs). Relative Smo mRNA levels after normalization to the corresponding 18S rRNA levels are expressed. Each assay was performed in triplicate. Data are means of three independent experiments; bars are SD values.