
Figure 3.
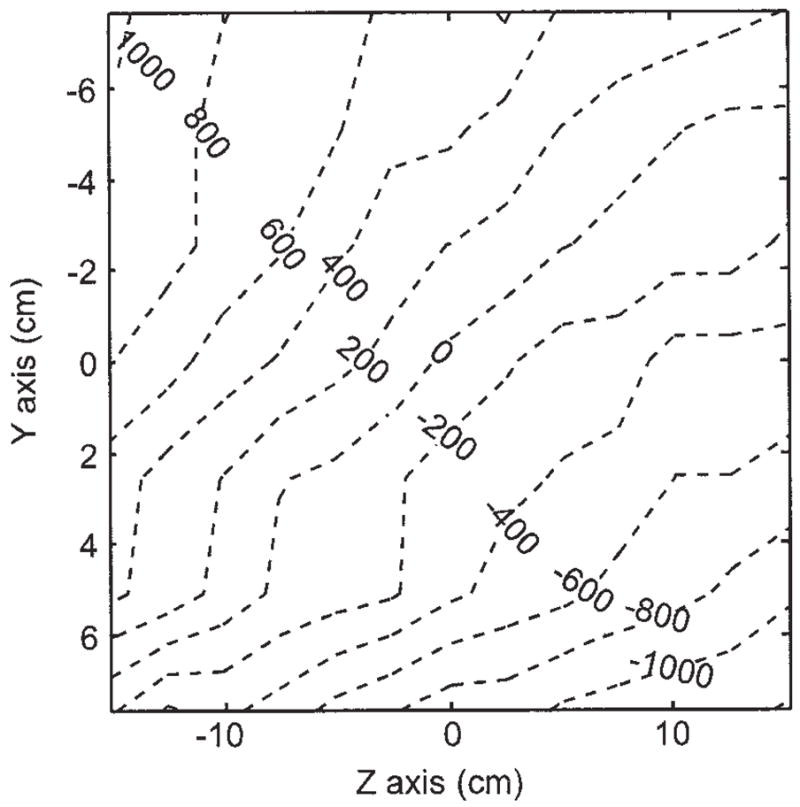
Measured B0 field deviation map (ppm). The plot was generated by moving a small water phantom along a 1 inch grid and recording the NMR frequency at each point.
Official websites use .gov
A
.gov website belongs to an official
government organization in the United States.
Secure .gov websites use HTTPS
A lock (
) or https:// means you've safely
connected to the .gov website. Share sensitive
information only on official, secure websites.
Measured B0 field deviation map (ppm). The plot was generated by moving a small water phantom along a 1 inch grid and recording the NMR frequency at each point.