
Figure 3.
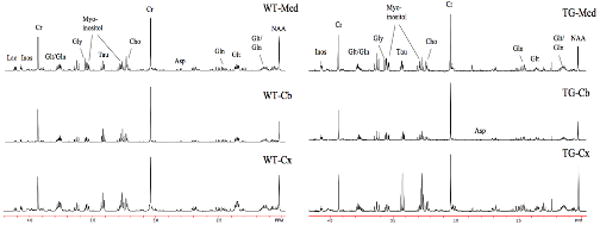
Comparisons of high resolution spectra (600 MHz) of brain extracts from medulla, sensorimotor cortex and cerebellum in a WT mouse and a FALS mouse. All three regional spectra are from the same mouse. There are numerous characteristic metabolic patterns that allow for separation between the different brain regions, and as well, numerous metabolic abnormalities that characterize the FALS mice.