
Figure 4.
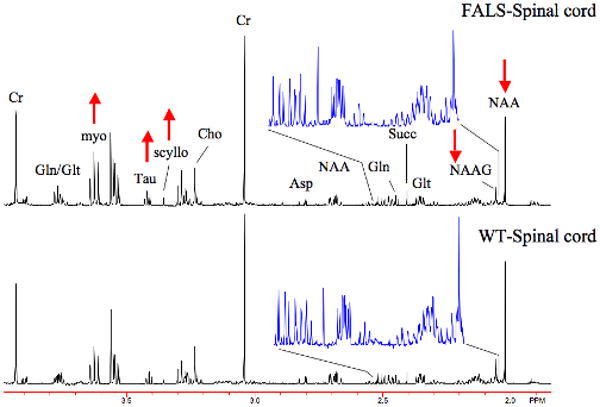
Spectra (600MHz) from spinal cord extracts of a FALS mouse and a WT mouse at 110 days of age. There are numerous abnormalities in the spinal cord of FALS mice (shown in Table 3). These include decreased NAA and NAAG as shown in the figure and in the expanded region between 2.04-2.5 ppm. These extracts are from cervical and thoracic spine.