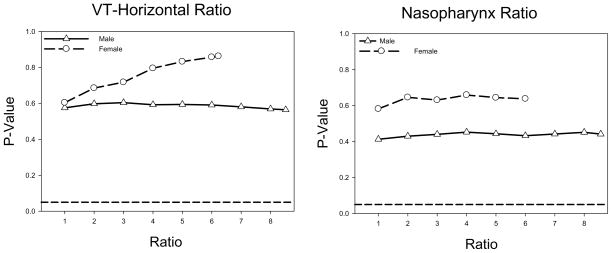
Figure 7.
Stability analysis results for the variables VT-Horizontal and Nasopharynx. The plots display the p-value of the race term in the growth model as a function of the ratio of the number of White subjects to the number of non-White subjects. The ratio range was affected by the number of available age matched White subjects which was more for males than females. The dashed line reflects the level of significance at the 0.05 level.

