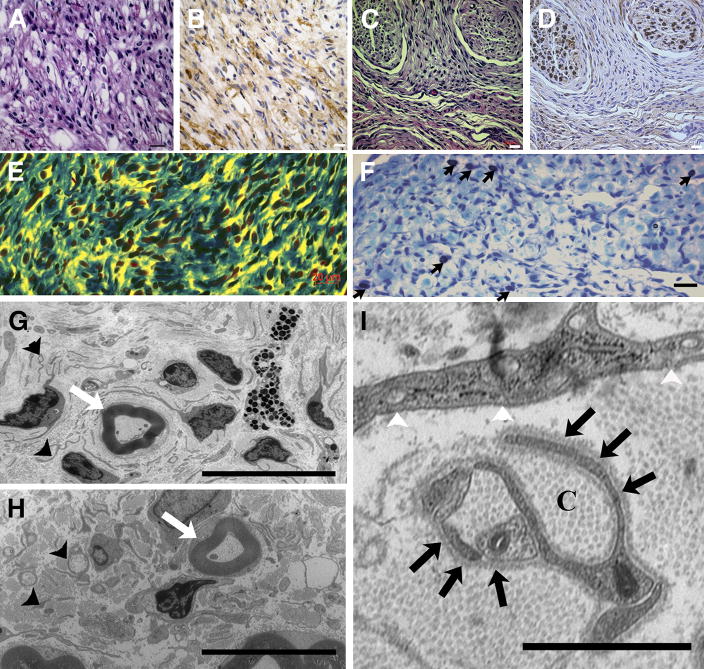
Figure 4. Nf1 flox/flox; DhhCre mice: histological and electron microscopic analysis.
Paraffin embedded tissue sections from plexiform and dermal GEM-neurofibromas stained with hematoxylin and eosin (H&E) (A and C). Adjacent sections were stained with anti-S100β antibody visualized with DAB [brown] (B and D). (E) Plexiform neurofibroma sections stained with Masson’s trichrome showing abundant collagen (blue) in the tumor. (F) Toluidine blue staining showing metachromatic mast cell infiltration (black arrows). Electron micrographs of plexiform (G) and dermal GEM-neurofibromas (H); small black arrowheads point to non-myelinating Schwann cells that are apparently not wrapping multiple axons. White arrows in G and H indicate intact myelinated fibers. In I, a higher magnification electron micrograph shows abundant collagen deposition (C) and prominent Schwann cell cytoplasmic processes identified by continuous basal lamina (black arrows). Fibroblasts are identified by prominent intracellular vesicles, prominent endoplasmic reticulum and patchy basal lamina. (Bar: A–F, 20μm; G, H=10μm; I=1μm).

