
Figure 2. The anterior level of dpERK responds to changes in the level of Bcd.
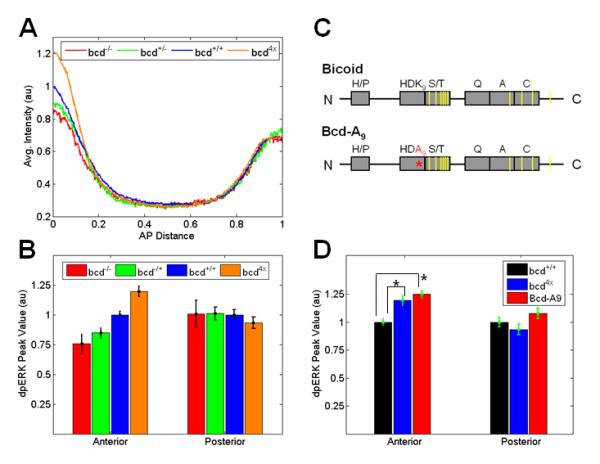
(A) The AP gradient of dpERK in progeny of females with different bcd copy number. Each line indicates an average gradient of dpERK for 20-25 individual embryos of the same genotype. Note that the anterior level of dpERK changes as the amount of maternal bcd present is altered, while posterior levels are not affected.
(B) Changes in the anterior and posterior levels of dpERK as a function of maternal bcd copy number. Each bar represents an average of MAPK phosphorylation for 20-25 individual embryos of the same genotype with standard error (SE) indicated. The data are normalized such that the values of wild type (bcd+/+, embryos marked with Histone-GFP) are set at 1. Only the anterior level shows an increasing trend as a function of bcd copy number (generalized linear model: pAnterior = 2.9 × 10⁻⁸, pPosterior = 0.30).
(C) Schematics of Bcd and a Bcd variant (Bcd-A9) used in the experiments. Gray boxes show following domains in the Bcd protein: the PRD repeat (H/P), the DNA binding domain (HD), the S/T rich domain, a glutamine rich domain (Q), an alanine rich domain (A), and an acidic domain (C). Putative MAPK phosphorylation sites (based on [14]) are indicated by yellow bars. Bcd-A9 encodes a Bcd variant with a single lysine-to-alanine amino acid substitution at position 50 of the homeodomain (K9 to A9, shown in red).
(D) Embryos expressing two wild type bcd and two copies of the bcd-A9 transgene show increased phosphorylation of MAPK at the anterior poles, similar to embryos with four copies of wild type bcd (bcd4x). Mean ± SE of 20-30 embryos for each genotype; (*) denotes a statistically significant difference from the wild type (t-test, p<0.01).