
Figure 3. Asymmetry of MAPK-mediated downregulation of Cic.
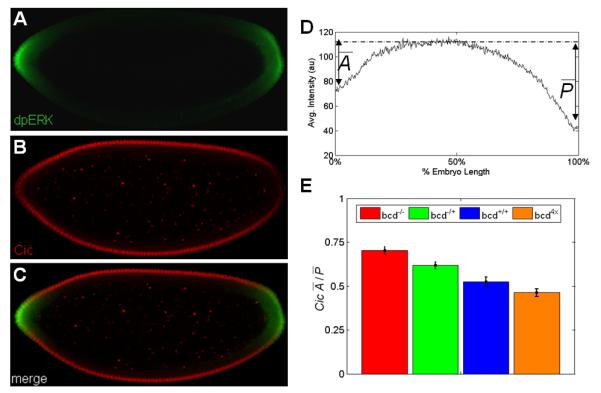
(A-C) Co-immunostaining reveals the spatial patterns of dpERK (green) and Cic (red).
(D) Averaged AP gradient of nuclear Cic at cell cycle 14 from 40 embryos. The dashed line indicates reference level of Cic repression. Similar to MAPK phosphorylation gradient, Cic pattern also exhibits a clear AP asymmetry.
(E) The dose of bcd affects the asymmetry of the spatial pattern of Cic downregulation in the early embryo. Each bar represents an average asymmetry of nuclear Cic gradient for 40-90 embryos of the same genotype. As the amount of maternal bcd mRNA is lowered, the anterior and posterior levels of Cic become more symmetric (generalized linear model: p = 2.5×10⁻¹²).