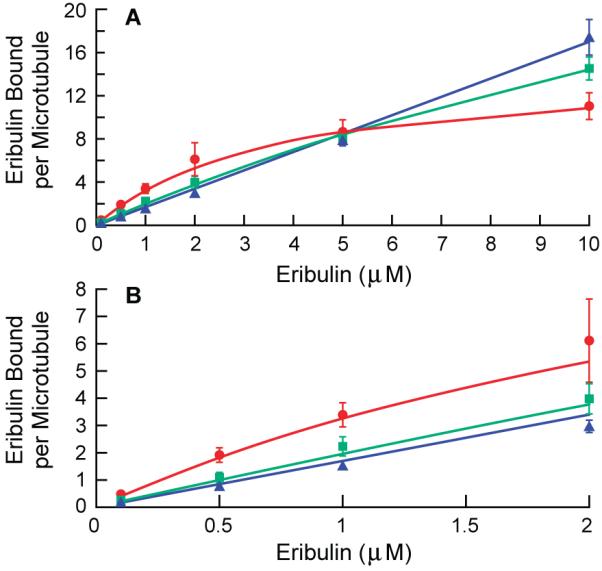
Figure 4.

Effects of vinblastine on eribulin binding to microtubules. (A) Vinblastine inhibited eribulin binding at low eribulin concentrations, but increased binding at high eribulin concentrations. (B) Enlargement of (A) showing effects of vinblastine at low eribulin concentrations. Vinblastine was added to microtubules and incubated for 15 min before [3H]eribulin was added. Eribulin binding in the absence of vinblastine (red circles), and in the presence of 2 μM vinblastine (green squares) and 4 μM vinblastine (blue triangles). Non-linear regression (Materials and Methods) was used to generate the curves for control and 2 μM vinblastine; a simple linear equation was used for 4 μM vinblastine.
