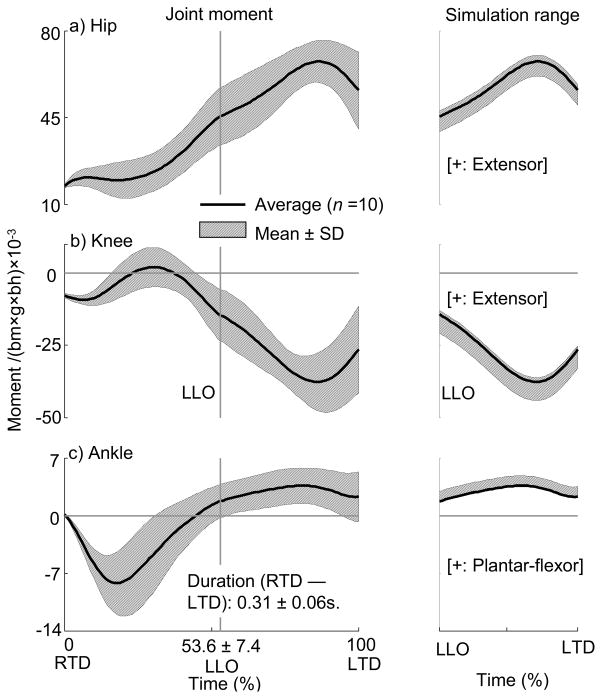
Fig. 2.
Left column: group mean (thick line, n = 10) ± SD (shaded area) profile of optimally-matched joint moments (τ, normalized by the product of the body mass, bm, the gravitational acceleration, g, and the body height, bh) from stance (right) foot touchdown (RTD) to left (swing) foot touchdown (LTD) for (a) stance hip, (b) stance knee, and (c) stance ankle. Hip extensor and knee flexor moments and ankle plantar-flexor moments were found to be the dominant moments that occurred in the stance limb for > 90% of single-stance phase in all subjects. Right column: the averaged simulation range (shaded area) during the single-stance from left liftoff (LLO) to LTD. The joint moments were systematically altered in forward-dynamics simulation by adding to or subtracting a fixed increment of 10−4(bm×g×bh) from each of these 10 subjects’ joint moment profiles. This process of augmentation would be iterated until the point at which the left foot contacted the ground before the termination of the perturbed simulation, or at which any joint angle from simulation became anatomically unrealistic, i.e., when it begins to exceed one standard deviation beyond the average range of motion for this particular joint. It is possible for one subject’s simulation range to be substantially different from the others.

